This is an article portfolio manager Christopher Joye published on Livewire recently.
Today I write that housing boom is tracking more or less exactly as we expected, and based on the RBA’s model of housing dynamics one should pencil in total capital gains of circa 20 per cent this cycle assuming no further reductions in rates. This has profound ramifications for portfolio construction. Click on that link to read the full column or AFR subs can click here. Excerpt enclosed:
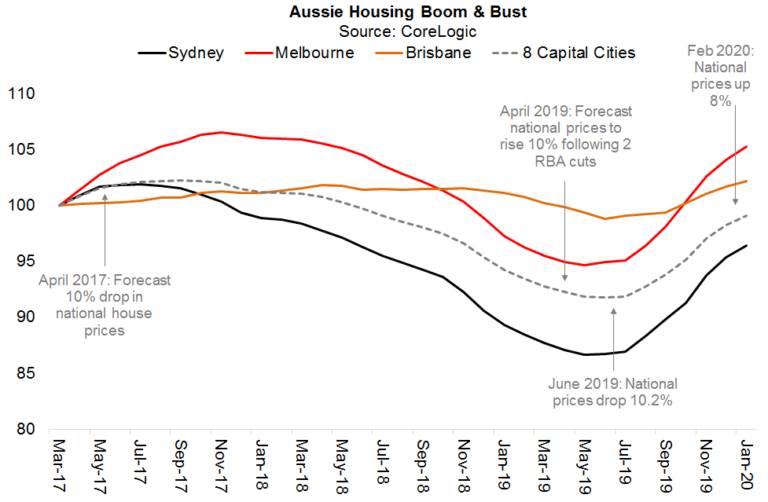
When house prices were still in free-fall back in April 2019, we controversially forecast that the record 10 per cent bust (which we predicted in 2017 when prices were still climbing) would promptly end and be superseded by a sharp 10 per cent rebound. To the best of my knowledge, no other investors shared this central case.
This was based on the assumption of two immediate RBA cash rate cuts, which would push home values up 10 per cent in the next 12 months. Martin Place duly delivered in June and July, and then poured more fuel on the flames with a third cut in October. And the central bank has implored borrowers to believe these rates will remain low for long.
According to a March 2019 paper published by two RBA economists, “a percentage point drop in the expected real mortgage rate would boost housing prices by 28 per cent in the long run”. We have had 68 of the 75 basis points of cuts passed-through to borrowers thus far, which implies home values need to jump by 20 per cent if these changes are perceived to be permanent.
If the RBA really wants to hit its legislated “full employment” target, and boost wage growth back to historical trend, it will need to shunt rates a lot lower than their current level notwithstanding its own stated “lower-bound” of a 0.25 per cent cash rate.
As I’ve explained before, getting the jobless rate down to between 4 per cent and 4.5 per cent (from its current 5.1 per cent mark) will require a large amount of additional monetary stimulus—much more than the RBA will get from the partial pass-through on the next two cuts. And this could easily push house prices 30 per cent beyond their June 2019 trough.
Across Australia’s eight capital cities, dwelling values are now 8 per cent above their mid 2019 nadir with Sydney and Melbourne prices leading the way with even stronger capital gains north of 11 per cent on a non-annualised basis.
This is a little stronger than the run-rate we outlined in April 2019 to get to 10 per cent appreciation over the following 12 months, but that analysis banked on two cuts and we have been furnished with three.
Unfortunately for the RBA, this price action betrays its intellectual hypocrisy. During the 2012 to 2017 boom the RBA repeatedly claimed that the 50 per cent increase in national prices had little to do with its slashing the cash rate from 4.75 per cent to 1.50 per cent.
No, other factors like population growth and inert housing supply were to blame even though its own internal research found that mortgage rates accounted for almost all the price inflation over this period.
Fast forward to 2020 and now the RBA tells us that the sudden boom in prices proves that its “monetary policy transmission mechanism is working”! Those Martin Place mandarins are the consummate politicians, which is why Treasurer Josh Frydenberg should be fretting about their attempts to control fiscal policy.
This is another classic case of hypocrisy: the RBA demands absolute political independence when it comes to monetary policy, but feels no hesitation whatsoever in seeking to (politically) influence fiscal policy.
When national house prices did indeed roll-over in 2017 along our expected 10 per cent draw-down trajectory, I completely exited about $400 million of residential mortgage-backed securities (RMBS) on the basis that their credit spreads would be forced wider given rapidly rising leverage and mortgage arrears.
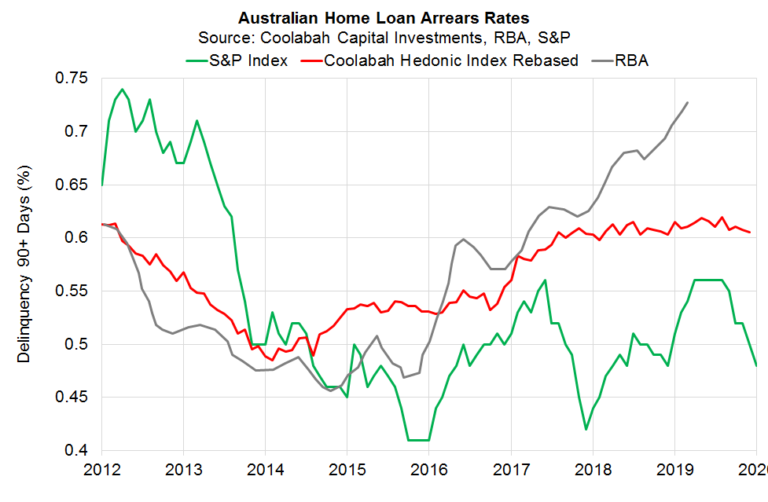
At the time, Standard & Poor’s RMBS arrears index signalled arrears were tracking side-ways in a benign fashion. This was inconsistent with anecdotal evidence that defaults were going up as a result of higher mortgage rates flowing from the regulator’s macro-prudential constraints on lending coupled with tougher refinancing conditions as banks tightened credit criteria, including reducing maximum loan-to-value ratios.
Our hypothesis was that record volumes of new RMBS issuance were flooding S&P’s index with clean (ie, default free) home loan portfolios that were artificially suppressing the index’s arrears rate when the true system-wide default rate was actually trending higher.
(S&P erroneously distinguishes between “arrears” and “defaults”, assuming that a missed repayment is not a default when under a loan contract you are in technical default the moment you miss a payment.)
So I asked my team to build the world’s first compositionally-adjusted RMBS arrears index that uses a multi-factor regression method to control for a range of portfolio biases that can spuriously influence reported arrears rates. These variables include the time since the RMBS bond was issued, the loan-to-value ratio of the mortgages, the weighted-average life of the loans, and their geographic location.
Our hedonic RMBS arrears index showed that default rates in Australia had, as we suspected, been appreciating consistently between 2014 and 2018. Combined with the biggest drop in house prices on record, this did eventually force credit RMBS spreads wider in 2018 and early 2019.
On the back of our 2019 view that the bust would be quickly replaced with another boom (which alongside lower mortgage rates would normalise arrears), we leapt back into the RMBS market, buying $756 million of AAA rated product.
And we can now see via our hedonic RMBS arrears index that mortgage default rates have flat-lined after four years of consistently increasing with the latest data hinting at the possibility they might actually start falling.
Our conviction in the robust housing recovery was also a key driver of our long-held forecast that S&P would be compelled to upgrade Australia’s economic risk score, which would in turn upgrade the credit ratings on the major banks’ Tier 2 bonds and AT1 hybrids to BBB+ and BBB- respectively, pushing the latter into the all-important “investment-grade” band. S&P finally obliged in in November last year.


